A free process control resource from Wastewater Solutions, Inc.help@ActivatedSludge.com  |  503-701-2766
ActivatedSludge.comPractical wastewater process control

Microscopy for Operators

The microscope shows you the living sludge. A short daily look tells you about floc strength, filaments and sludge age before the lab numbers change.

What to look at

Floc formationDispersed bacteria clump together with extracellular polymer into small flocs, then into mature flocs supported by a few short filaments.Dispersed bacteriayoung sludge, cloudySmall floc formingEPS glues cells togetherMature flocfirm, settles well, short filaments as backboneFloc formation: from single cells to settleable floc
Floc structure at 100x: firm floc with a few internal filaments and a clear background is the goal.
  1. Floc: size, shape, strength, background clarity.
  2. Filaments: abundance (0 to 6), inside or bridging, type if known.
  3. Protozoa: amoebae, flagellates, free-swimming, crawling and stalked ciliates.
  4. Small animals: rotifers, nematodes, water bears.
Healthy floc, filamentous bulking and pin floc comparedThree microscope views with settleometers: healthy floc with a few internal filaments settles well with a clear supernatant; filamentous bulking with filaments bridging flocs settles slowly to a high blanket; pin floc of tiny particles settles fast but leaves a turbid supernatant.Three floc conditions comparedHealthy flocFilamentous bulkingPin flocSettles well, clear supernatantSVI usually 80 to 150Filaments mostly inside flocSettles slowly, compacts poorlyHigh SVI, blanket may riseFilaments bridge between flocsSettles fast, turbid supernatantLow SVI, cloudy effluentFew or no filaments, long SRTDrawings show a 100x view and a 30 minute settleometer for each case. Not to scale.
Healthy floc, bulking and pin floc. Three 100x views, each with its 30 minute settleometer result. What this indicates: Filaments bridging flocs mean high SVI and slow settling; tiny, filament free pin floc settles fast but leaves a cloudy supernatant, often from too long an SRT. Original illustration for this site, not to scale.

Indicator succession

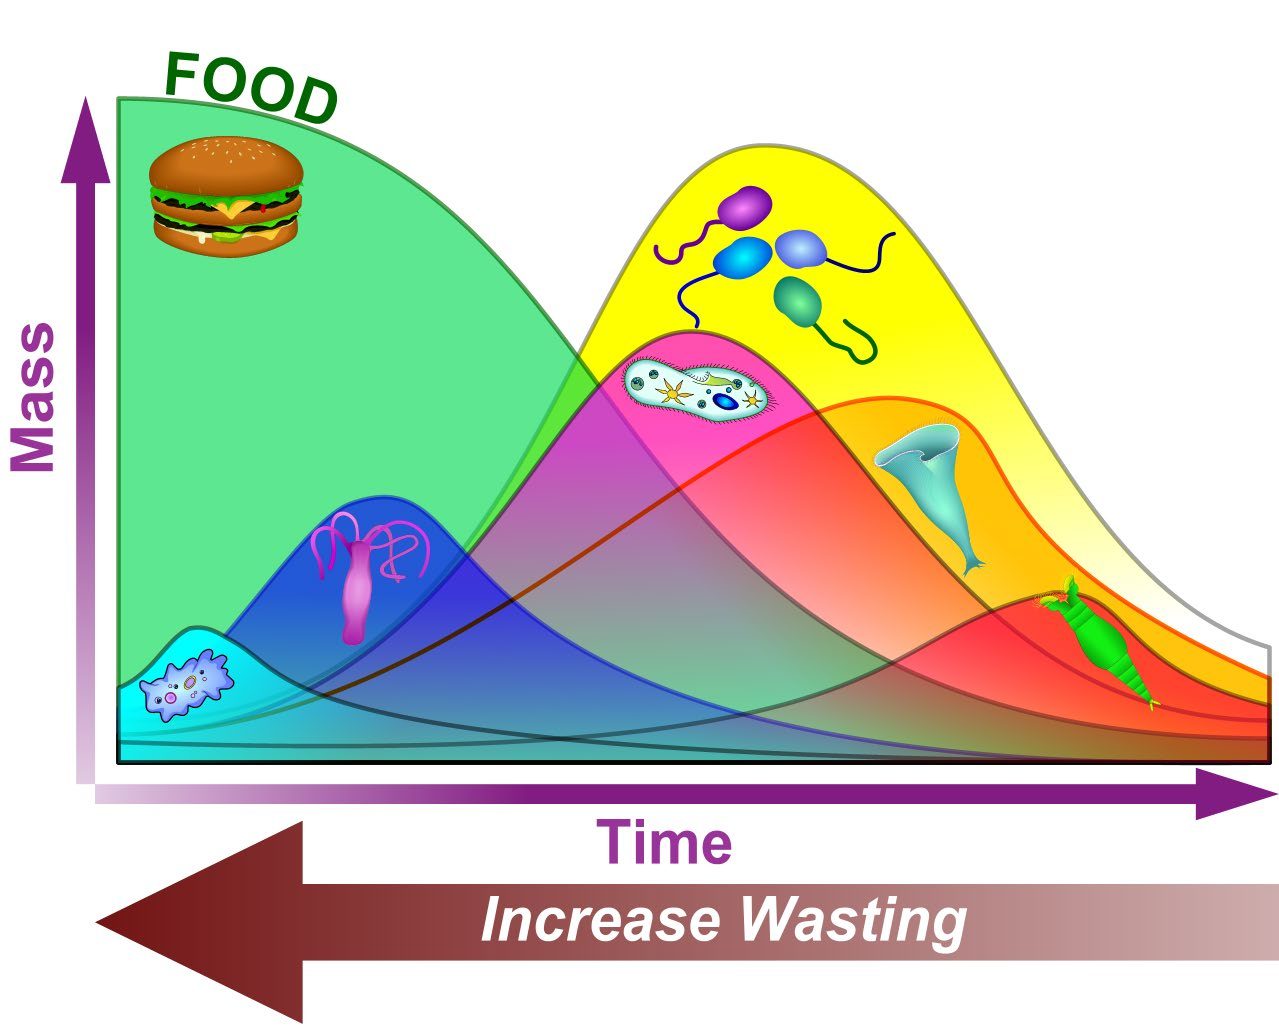
Young sludge favors amoebae and flagellates; as sludge matures, free-swimming ciliates, then crawling and stalked ciliates, then rotifers and nematodes become prominent. Changes in this balance tell you something has changed in SRT, DO, load or toxicity.

Graph of mass against time: food falls while amoebae, then flagellates (the stylized pink drawing on the second curve), free-swimming ciliates, stalked ciliates and finally rotifers rise and fall in turn; an arrow under the time axis shows that more wasting moves the sludge back toward the left
Relative predominance of organisms. As food is used up over time (longer sludge age, lower F/M), the dominant organisms shift from amoebae (first curve) and flagellates (second curve) to free-swimming ciliates, then stalked ciliates and finally rotifers. Wasting more sludge pushes the population back toward the left. What this indicates: Which group dominates your slide tells you roughly where the sludge sits on this curve. Many flagellates and amoebae mean a young, high F/M sludge; stalked ciliates and rotifers mean an older, low F/M sludge. Graphic: Brad Musick
Protozoa groupsSix panels: an amoeba with pseudopods, small flagellates with whip like flagella, an oval free-swimming ciliate covered in cilia, a crawling ciliate walking on floc, two bell shaped stalked ciliates on a floc, and a suctorian with knobbed tentacles on a stalk.The six protozoa groups operators trackAmoebaeFlowing pseudopods, slowYoung sludge, startupFlagellates5 to 20 microns, whip like tailYoung sludge, high soluble BODFree-swimming ciliatesCovered in cilia, fastYounger sludge, dispersed bacteriaCrawling ciliatesWalk on floc with cirriStable, well flocculated sludgeStalked ciliatesBells on stalks, ring of ciliaMature, stable sludgeSuctoriansTentacles catch other protozoaMature, older sludgeGreen text: what a large number of each group usually suggests. Line drawings, not to scale.
The six protozoa groups. Original line drawings of amoebae, flagellates, free-swimming, crawling and stalked ciliates and suctorians. What this indicates: Which group you see most of hints at sludge age: amoebae and flagellates for young sludge, crawling and stalked ciliates and suctorians for mature sludge. Original illustration for this site, not to scale.
Higher life formsFour panels: a rotifer with a two lobed ciliated crown and forked foot, a smooth nematode worm, a segmented Aeolosoma bristle worm with bristle tufts and colored spots, and a water bear with eight clawed legs.Higher life forms in activated sludgeRotifer100 to 500 micronsCiliated crown, forked footNematode0.5 to 3 mmSmooth roundworm, thrashesBristle wormAeolosoma, up to 10 mmSegments, bristle tufts, color spotsWater bearTardigrade, 0.1 to 1 mmEight stubby clawed legsAll are multicellular and usually point to an older, stable sludge with a longer SRT.
Higher life forms. Rotifer, nematode, bristle worm (Aeolosoma) and water bear (tardigrade), with typical sizes. What this indicates: These multicellular animals grow slowly, so steady numbers usually mean a long SRT and a stable, well oxidized sludge. Original illustration for this site, not to scale.

The microscopy library

Each page covers what you see, what it may indicate, and what process data to check next:

Not sure what you are looking at? Try the Identify what I'm seeing questionnaire.

Filaments and settling

Filamentous bulking compared with good settlingTwo settleometers: one settles to 280 mL/L, one with filamentous bulking only to 820 mL/L. Microscope sketches show compact floc compared with filaments bridging between flocs.280Good settlingSSV30 280, SVI about 95820Filamentous bulkingSSV30 820, SVI about 280Compact flocFilaments bridge flocsBridging holds flocs apart, so thesludge cannot compact in the clarifier.
Filaments extending from floc hold particles apart and cause bulking.

When filament abundance reaches about 4 (very common) and filaments bridge between flocs, SVI usually rises. Identify the type, match it to the probable cause, and check that condition in your data.

A simple routine

  • Same sample point and time as the settleometer.
  • 100x scan of the whole cover slip, then 400x.
  • Record on the same form daily; take photos.
  • Stain for filaments weekly or when abundance rises.